Case Study


IAM Survey

Challenge

The IT information security team at the client agency had been collecting identity access management (IAM) data via Google surveys from internal application owners on what tools, technologies and capabilities they had in place to perform identity, credentialing, authentication and authorization. This data collection was part of a broader program to develop a new security framework and architecture which would unify the many and disparate identity management mechanisms used by different applications. Due to the number of applications, the surveys were being performed in phases. Also, given the complexity of the applications the surveys were designed to capture answers to survey questions in free form text to allow the respondents the ability to provide detailed information. As a result, the client asked for assistance with the visualization of the data and deriving insights from the detailed responses.

Solution

OmniSolve worked with the client and key stakeholders to discuss using Tableau to develop the visualizations. While in general these were simple tasks on paper, the OmniSolve team realized that given the free form nature of the survey responses, in reality there was going to be a fair amount of data cleansing and report classification required before any visualizations could be developed and data mining for insights could be performed.

Outcome

The OmniSolve team cleansed and aggregated all of the IAM survey results into a single reporting data set. The cleansing tasks included addressing missing data, errors and anomalies, reformatting issues such as text and numeric formats, adding report categories and classifiers to assist with data mining. Aggregation tasks included focussing on creating a single analytic and reporting data record for each owner-application which could be synthesized and data mined for insights.

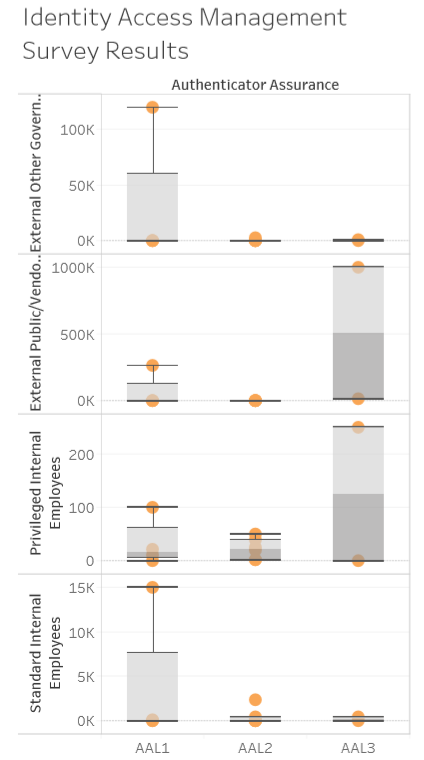
Once the IAM reporting data set was ready, a dashboard was created in Tableau. The Tableau dashboard included visualizations for IAM survey summary results. Visualizations included areas such as,

  • Employee and non employee usage counts
  • Identity and authentication assurance comparatives
  • Top 10 Protocols and entitlement solutions

These profile views allowed the stakeholders in IT security and enterprise architecture teams to develop the current profile and security posture, including gaps in capabilities and duplicative and obsolete technologies.

Technologies & Methodologies

Tableau
Featured Experts
Rina Basu
Rina Basu