
Case Study

Data Integration
Challenge
Our client's priorities were to move from low value to high value work while providing better customer service to IT. However, there was no capability to enable holistic views of projects that allowed IT leadership to view projects in-flight and manage workloads across the organization. In addition, the lack of a common view of the disparate projects data (budget, contracts, capabilities, etc) meant that IT organizations were not working off a common language when discussing future state roadmaps/architectures. As a result, the client wanted to prototype integrated views that would allow them to make better data driven decisions by having a holistic view on their portfolio. For the initial proof of concept, they wanted to focus on how IT leadership can utilize an integration of specific data sets like contract and budget data to help understand these questions.
Solution
OmniSolve worked with the client and key stakeholders to discuss possible solutions. Even though this effort was to show what could be prototyped when bringing all of the data together, the existing state of data capture, storage, and data health in general at the agency was not enough to demonstrate the portfolio view they were looking for. During these discussions we noted the following major pain-points:
- Systems and data were siloed in multiple spreadsheets.
- Data reliability and cleanliness were questionable.
- Low data integration and quality lead to poor adoption of ANY system put in place to wrangle data together to analyze.
Based upon these discussions, OmniSolve proposed a 2-pronged approach for the proof of concept:
- A framework for a data pipeline, including a unified data store, to provide the infrastructure and strategy.
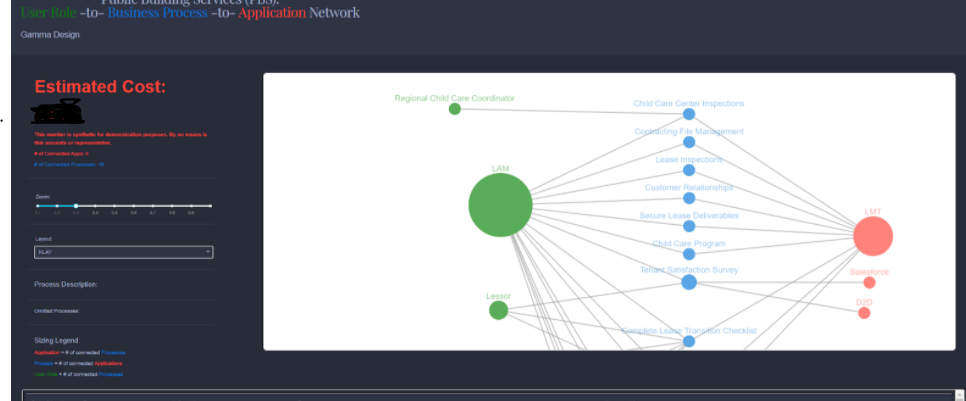
- An interactive network graph visualization prototype to show relationships between applications and capabilities, one of the key areas the client needed insight into.
Outcome
- Developed guidance on how a robust data pipeline and unifying data under a single data store could enable more data exploration, which could be designed to be agnostic to how or what tool is used to access the data.
- Developed an interactive business capabilities network graph prototype using Python & Plotly to show a live visualization of how integrating disparate data could lead to insights that are difficult to realize with siloed and complicated data.
- Developed a visual network business capabilities, the applications that serve these capabilities.
- Demonstrated how the visualization could be used to find insights common or duplicative business capabilities.
- Further demonstrated how integrating TBM cost data to show the potential costs associated with these applications.
Technologies & Methodologies
 |
 |
| Python | Plotly |
Featured Experts

Rina Basu